A boost in new listings nationally, along with price cuts, favors buyers. The local picture, however, is a mixed bag.

What’s going on this fall in the housing market? It depends on where you look.
Nationally, home values saw a “marked cooldown” from July to August, according to Zillow® Senior Economist Jeff Tucker, with prices rising just 0.2%. That’s due in part to the effect of interest rates, which are hovering near recent highs and raising borrowing costs for buyers.
Locally, the story is more complicated. In 32 of the nation’s 50 largest markets, home values rose from July to August, according to Zillow research. But in 12 of them, values declined.
What this means for you depends on where you own or are looking to buy, and what you think the market in your area will do in the future. For buyers hoping to get into the market, there are some encouraging new signs.
Playlist Error: This content is currently unavailable from within your country.
The national picture: price cuts and longer selling times
The market remains a tight one, with fewer homes for sale this year than last year, Tucker says. And the typical U.S. home value now sits at $351,423 — a record high and 1.3% higher than last year.
But the housing market usually slows in the fall, and this year looks like it will follow that trend:
- Since June, more sellers are cutting prices — 23% of listings have price cuts.
- The number of homes selling over listing price dropped slightly to 40%, Zillow research shows.
- The pace of sales has also slowed slightly, which means less competition and more time for home buyers to shop.
The most surprising news: The number of homes newly listed for sale also increased slightly (4.0%) from July to August.
Metros where home prices have changed the most
Zillow research finds that home values climbed in 32 of the nation’s 50 largest metro areas from July to August. A dozen other metros saw values drop during that period.
Metros that saw the biggest monthly increase are:
- Hartford, CT (1.3%)
- Buffalo, NY (1.0%)
- San Diego, CA (0.9%)
- Cleveland, OH (0.7%)
- Providence, RI (0.7%)
Metros with the biggest monthly drops are:
- New Orleans, LA (-1.4%)
- Austin, TX (-1.0%),
- San Antonio, TX (-0.4%)
- Denver, CO (-0.2%)
- Dallas, TX (-0.2%)
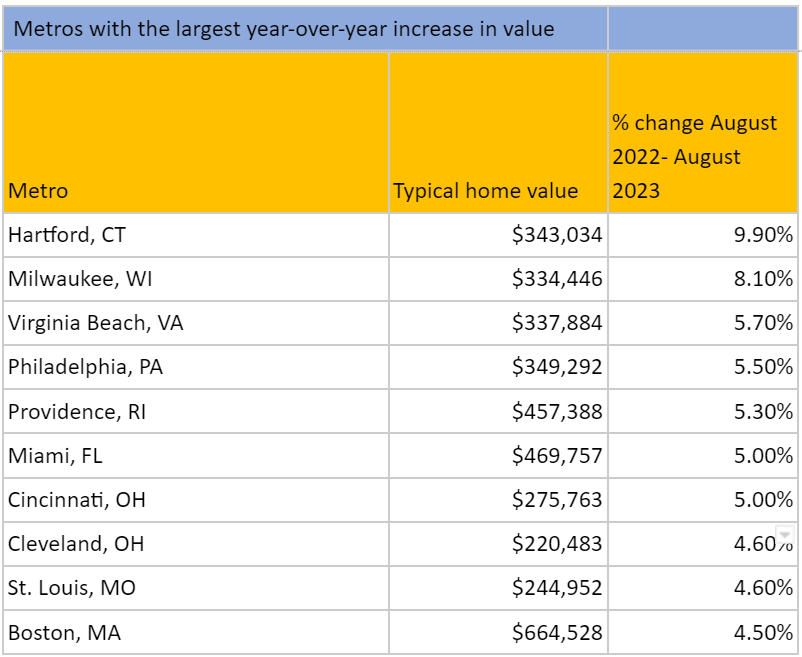
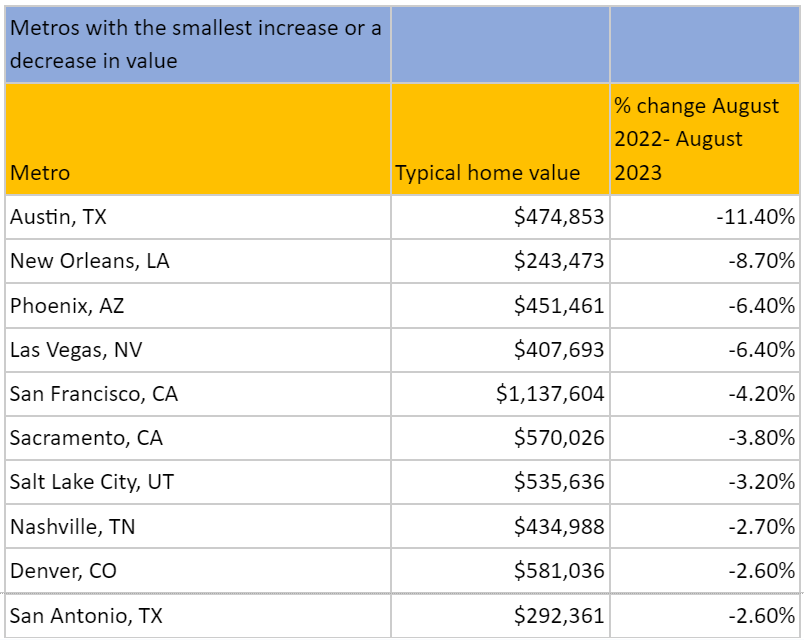
The changes are even bigger when compared to a year ago:


“Why are home prices going up/down in my neighborhood?”

Local variations in home appreciation are due to a number of factors that affect supply and buyer demand. They include:
1) Economic conditions and job opportunities. Metros with strong economic growth and a thriving job market tend to attract more people, leading to increased demand for housing and higher home values.
2) Infrastructure development and amenities. People are willing to pay a premium to live in metros with well-developed infrastructure, such as efficient transportation systems, quality schools, healthcare facilities, and recreational areas.
3) Demographic trends. Things like population growth, aging populations, and migration patterns can influence housing demand and, subsequently, home prices. Metros with significant population growth or younger demographics may experience higher rates of home value appreciation.
Talk to your agent or lender about what local trends may mean for you
There is no one right time to buy for everyone.
Even sophisticated real estate investors find it difficult to time the market for the best deal, so experts recommend that you buy when you need to and when the time is right for you.
Your agent is your expert on local market conditions. They can help you shape an offer that takes rising or falling prices and other special things about your area into account when writing an offer or assessing whether a property is a good deal for you.
The trends described above can help you discuss with your agent whether you’re likely to pay more by waiting or whether buying now makes more sense.
